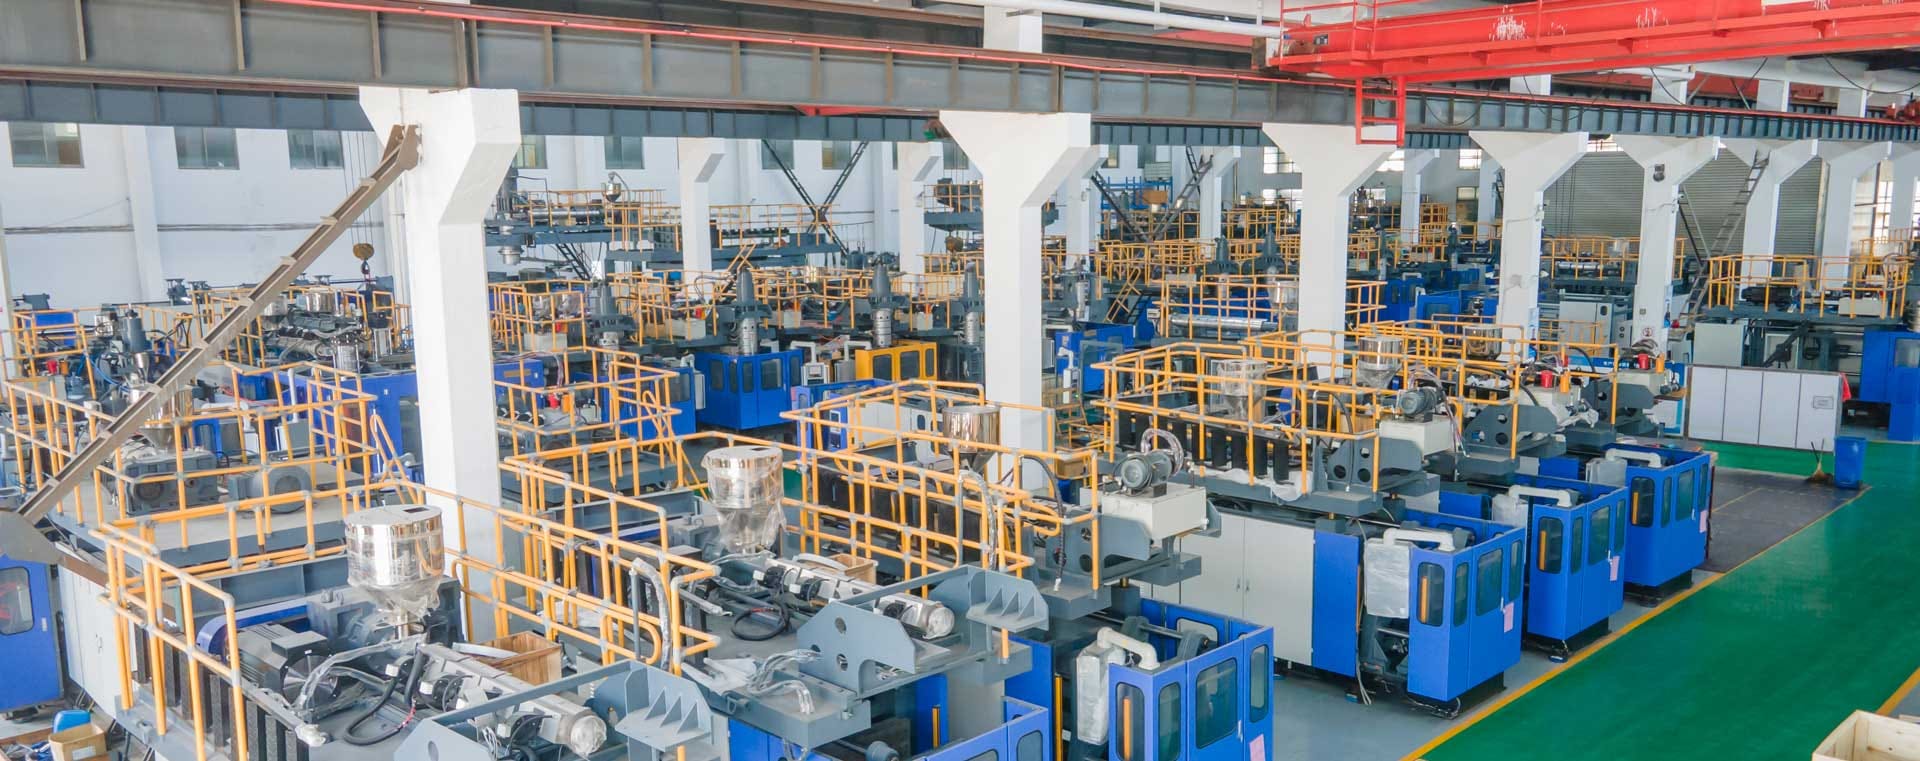
Published 4 min readTechnology
Reduce agrochemical container cost by measuring the material, energy and operating inputs needed for each accepted package. A lower machine price, tighter weight variation or a high flash-recovery percentage can be useful information, but none of these alone proves a lower production cost.
This guide turns Tongda’s HSII-12L manufacturing discussion into a practical trial and costing method. It separates a three-layer PE construction with a controlled regrind core from a barrier structure, and keeps package performance as the condition for accepting any saving.
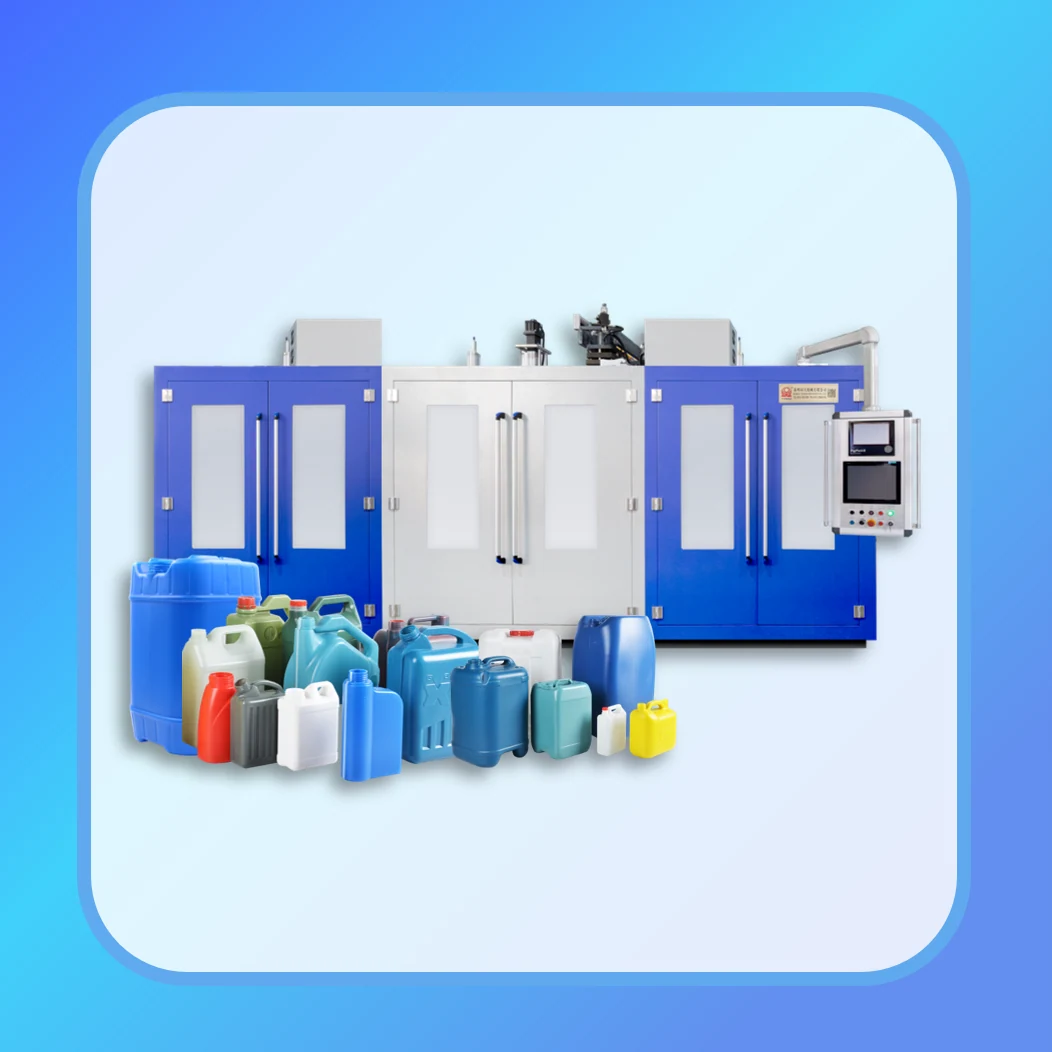
Set the cost boundary and the accepted unit
Define an accepted container as a part meeting the agreed inspection requirements. Decide whether the cost comparison ends after molding, after leak testing, or after filling and packing. Use the same boundary for both production options.
For an agreed production period, a useful starting expression is:
Cost per accepted container = net material cost + energy + labor + maintenance + allocated equipment and tooling cost, all divided by accepted output.
Use costs for the same period, and treat recovered material consistently. Include drying, cooling, compressed air, granulation and inspection when they fall inside the selected boundary. Record changeover losses and the treatment of startup production.
| Record | Required distinction |
|---|---|
| Product weight | Mean net weight versus the spread of sample weights |
| Material | Purchased input, reusable internal material and material leaving the system |
| Output | Accepted containers versus all molded containers |
| Energy | Metered production consumption versus motor nameplate power |
Start with a wall structure that suits the contents
A three-layer PE wall may use virgin material at selected surfaces and qualified regrind inside. Its suitability depends on the material source, recipe, package design and intended contents. A virgin inner layer is not a substitute for compatibility testing.
This construction is also different from an EVOH-containing barrier wall. Adding a regrind core does not automatically improve solvent resistance. If barrier performance is required, use the multilayer pesticide-bottle guide to frame that specification before comparing material prices.
Separate weight repeatability from weight reduction
Tighter variation can help the process remain inside the approved product limits. A resin-saving claim additionally needs a lower mean net weight with equivalent accepted performance. A statement such as “within ±3 g” describes a spread only when its reference and measurement method are defined; it does not mean 3 g was saved.
Consider a hypothetical example. Reducing a qualified container from 120 g to 115 g, over 400,000 accepted containers, reduces net polymer retained in finished products by 2,000 kg. At USD 1.30/kg, that corresponds to USD 2,600 of product-material value before other changes in the material balance and operating costs.
This is an illustration, not an HSII-12L result. Recheck wall distribution, closure fit, stacking and handling performance before adopting the lower weight. Then compare actual purchased-resin consumption and permitted reuse; net product weight alone does not capture all plant losses.

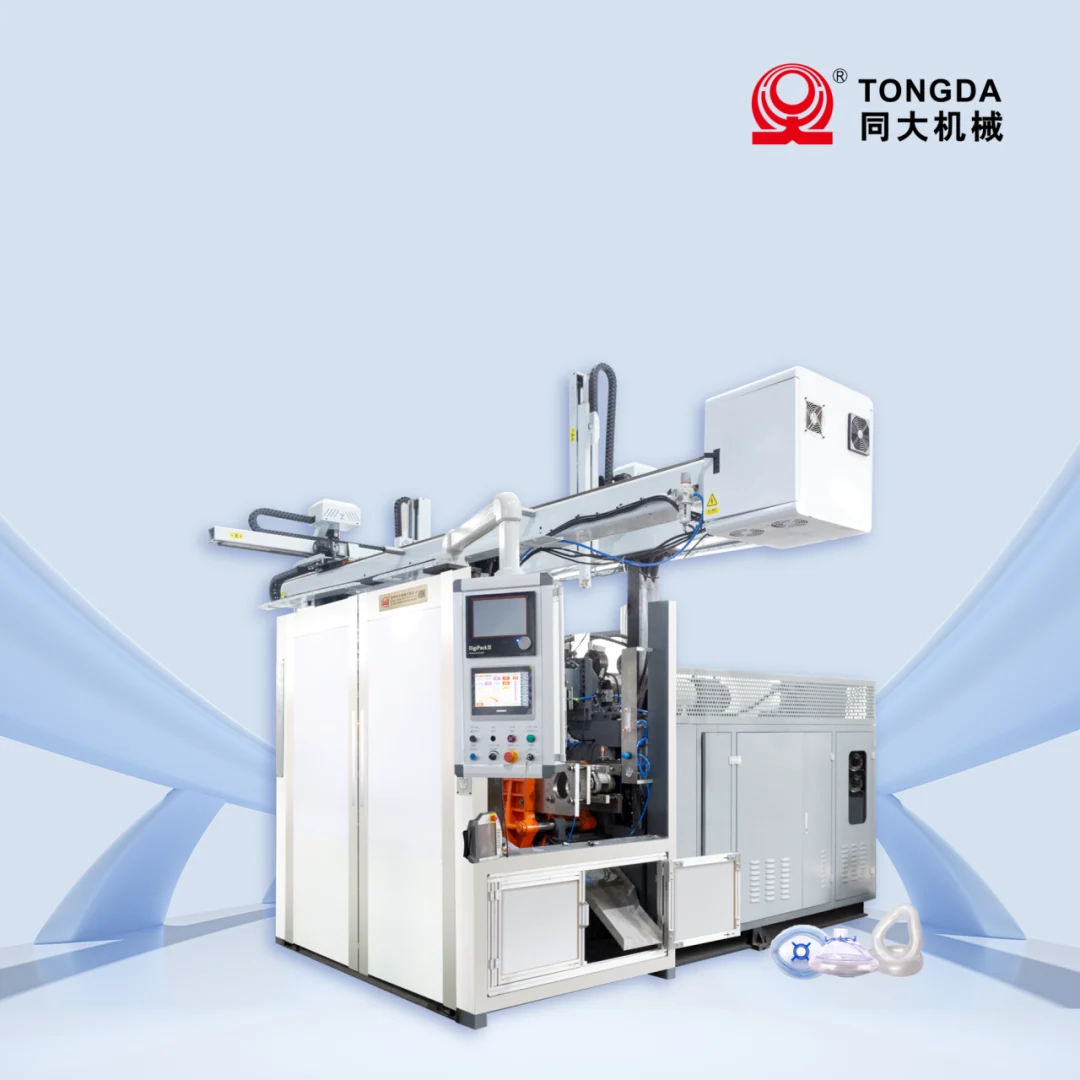
Keep flash collection, reuse and recycled content separate
The original project discussion reports 93% scrap recovery without a complete measurement basis. Do not use that number as the container’s recycled content or as a reduction in total resin purchasing.
Track the flash generated, material collected, usable granulate recovered and material actually returned to an approved recipe. Weigh unusable fines, contaminated material and rejected containers separately. Internal material that is processed twice should not be charged as two new purchases, but its handling and processing costs still matter.
Use a mass balance over a defined period and account for changes in stored material. This prevents an apparent saving caused simply by drawing down an existing regrind inventory.
Test drive and automation choices on the same job
Compare kWh per accepted container using the same material, mold, mean weight and output requirement. Define whether auxiliaries are included. Lower installed power or idle consumption does not directly establish the production result.
For automation, record operator time, rejects, inspection capacity and interruptions as well as the fastest cycle. A faster machine may produce no additional accepted containers if trimming or inspection is already the limiting step. Include changeovers and maintenance in the investment comparison; the all-electric ROI guide provides a separate payback framework.
Questions buyers ask
Is a regrind-core container automatically suitable for agrochemicals?
No. The contents, material recipe, wall structure and closure must be assessed for the actual package. The ability to mold a part does not establish its filled-package performance.
What is the most useful number for comparing machines?
Use cost per accepted container under an agreed trial and cost boundary. Keep the underlying material, energy and output records so differences can be explained rather than hidden inside a single percentage.
What should Tongda receive for a cost-focused enquiry?
Provide drawings, contents, current weight and output, material recipes, inspection requirements and available production records. Review the HS II-12L platform or jerry can applications, then request a production review with a measurable baseline.
Source material: Tongda WeChat article 11. Source photographs and video stills retain the original equipment details. English concept illustrations are identified in their captions.